Implementing a New System? Here's Why Reporting Requirements Should Be Top of Your List
Tue, March 12, 2024- by Paul Saxton
- 4.5 minute read

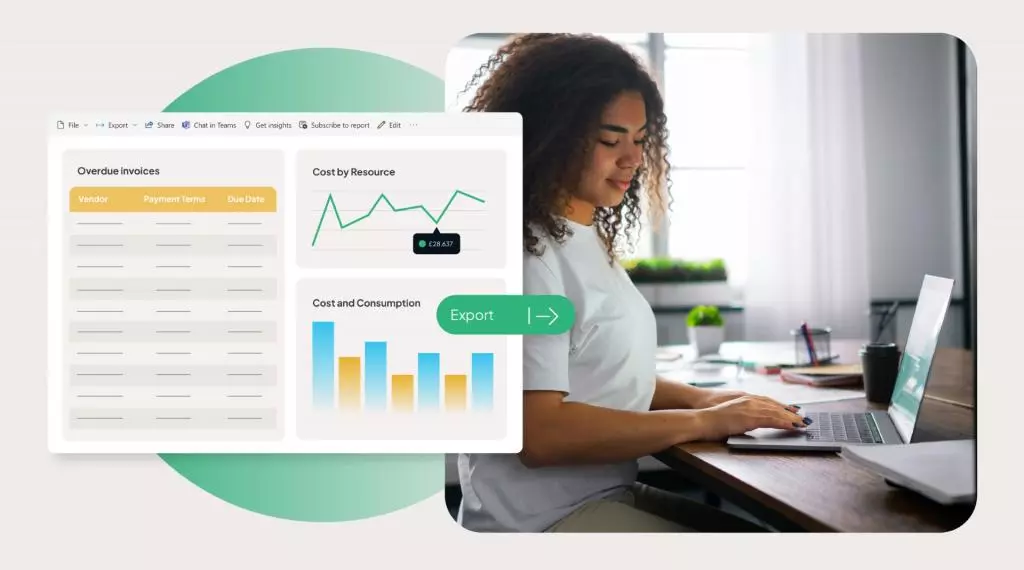
Every company we speak to wants to adopt a data-driven culture — one that lets them extract actionable insights from their data to make data-informed decisions.
But achieving that isn’t always easy with the kind of operational, surface-level reports that come as standard with most systems. Nine times out of ten, it’s impossible.
That’s why you need to spend time customising these reports to your company’s unique needs and use a third-party analytics platform to get the insights you want. It’s also why you must set aside time to build custom reporting capabilities whenever you implement a new system.
In this article, we’ll explain the limitations of out-of-the-box reports, why customised reports make your data much more actionable and how time spent building customised reports when implementing new software will pay dividends in the future.
Standard reports are just that…standard
Standard reports are a great start. They usually provide some fairly insightful granular information, but they are not the finished article. In fact, they are rarely sufficient for a data-centric business’ needs.
That shouldn’t come as a surprise, though. In the same way your new system didn’t do exactly what you wanted out of the box, neither will its reporting capabilities.
What tends to happen is that standard reports give you access to data. But there’s a big difference between having data and being able to do something with it. You see, most standard reports serve an operational purpose — not an analytical one. They tell you what’s happening with your new system, like how many contacts are being updated in your CRM or the potential value of deals in your pipeline. But they don’t provide the kinds of actionable insights you can use to improve your sales and marketing efforts.
This is particularly true in Dynamics 365. The platform has plenty of reporting capabilities, including the following:
- List Pages: A form of operational reporting that displays lists from an existing table.
- Excel Integration: This allows data management and analysis using Microsoft Excel.
- Embedded Analytics: Add aggregate data to Workspaces using native controls like charts and grids.
- Reporting Services: Create business documents that require precision using SSRS-based solutions.
- Financial Reporter: A solution to help users create financial reports.
None of the above will be a perfect fit for your business right off the bat, however. You’ll need to tailor them to your company’s unique needs to generate the valuable insights you’re looking for.
In fact, when Microsoft analysed the reports in their systems, they found users modify around 80% of them. Further, most of the unchanged reports were system or admin reports.
Take things further with truly customised reports
Standard reports don’t just suffer from a lack of specificity and nuance. They also fail to capture quite a lot of information our clients find useful.
Take the way in which your data has changed over time, for instance. While standard reports are great at showing a snapshot of what’s happening in your system right now, they usually don’t maintain a historical record.
For example, you can use a CRM report to see how many records are incomplete this month. But you can’t see how many records were incomplete last month or last year. You also don’t know who’s changed what or how often each record is changed.
Most standard reports are also transactional, meaning they can only track things that have happened—not events that haven’t happened. Take sales forecasts, as an example. How often have you monitored your forecast, only to see a huge shift close to the month's end? Where did the deals go, what changed? You need an analytical solution to provide you access to what would have been.
Finally, there’s also an issue with siloed data. If your reporting requirements span more than one system, then there’s no way that one system’s reporting tools will ever be able to give you the answers you need.
That’s why a solution like 5Y’s Unified Data Platform is so powerful. By providing an independent data lake, our solution provides a single source of truth that ingests data from multiple sources to give a holistic view of everything.
The more you do now, the easier it will be later
Where possible, you should always build out custom reporting capabilities during the implementation phase of a new system. The more time you spend building out custom reports at the start, the easier and faster it will be to generate insights when you need them.
You won’t need to manually extract or format data, for instance. Or waste time making standardised reports fit your needs every month. In other words, a little time spent now can eliminate all those tedious and recurring tasks each department has to complete when reporting.
Of course, that also frees up more time for analysis. By eliminating low-value reporting tasks, your teams have more time to put insights into action, whether that’s finding ways to save the company money or optimising intra-departmental processes.
So, what does this look like in practice?
We believe that if you’re implementing a new business system, you should be spending at least 20% of the time creating reports. Only part of that time is spent building the actual reports, of course. You’ll also need to define your goals and objectives, assess your data sources, and work out what reports you don’t have access to as standard.
Work smarter, not harder, with 5Y
The good news is you don’t have to toil away for dozens of hours to create the analytics reports you need. We’ve designed our Unified Data Platform to provide 80% of your BI reporting requirements out of the box, allowing you to take the guesswork out of decision-making and start getting insights faster.
Find out just how fast and easy 5Y has made customised reporting by booking a demo today. Alternatively, request a custom quote, and we’ll show you exactly how cost-effective the 5Y Unified Platform can be.

 Saudi Arabia


