United Kingdom


Fixed Assets Reporting & Analysis
Get a 360-degree view of the financial health of your organisation, including all ledgers and transactions with the 5Y Fixed Assets Analytics Solution.
We empower CFOs and finance directors to analyse the health of their fixed assets and make managing them a competitive advantage
Our Fixed Assets Analytics Solution makes it quick and easy for finance leaders to understand the financial performance of their facilities, equipment and land. Use standard and customised reports to accurately value assets, forecast depreciation and improve operational efficiency.
Asset Value Reports
Analyse the value of all of your organisation’s fixed assets in real-time and accurately forecast future deprecation.
Asset Location Analysis
Accurately track and monitor the location of all company equipment to reduce the risk of theft or loss.
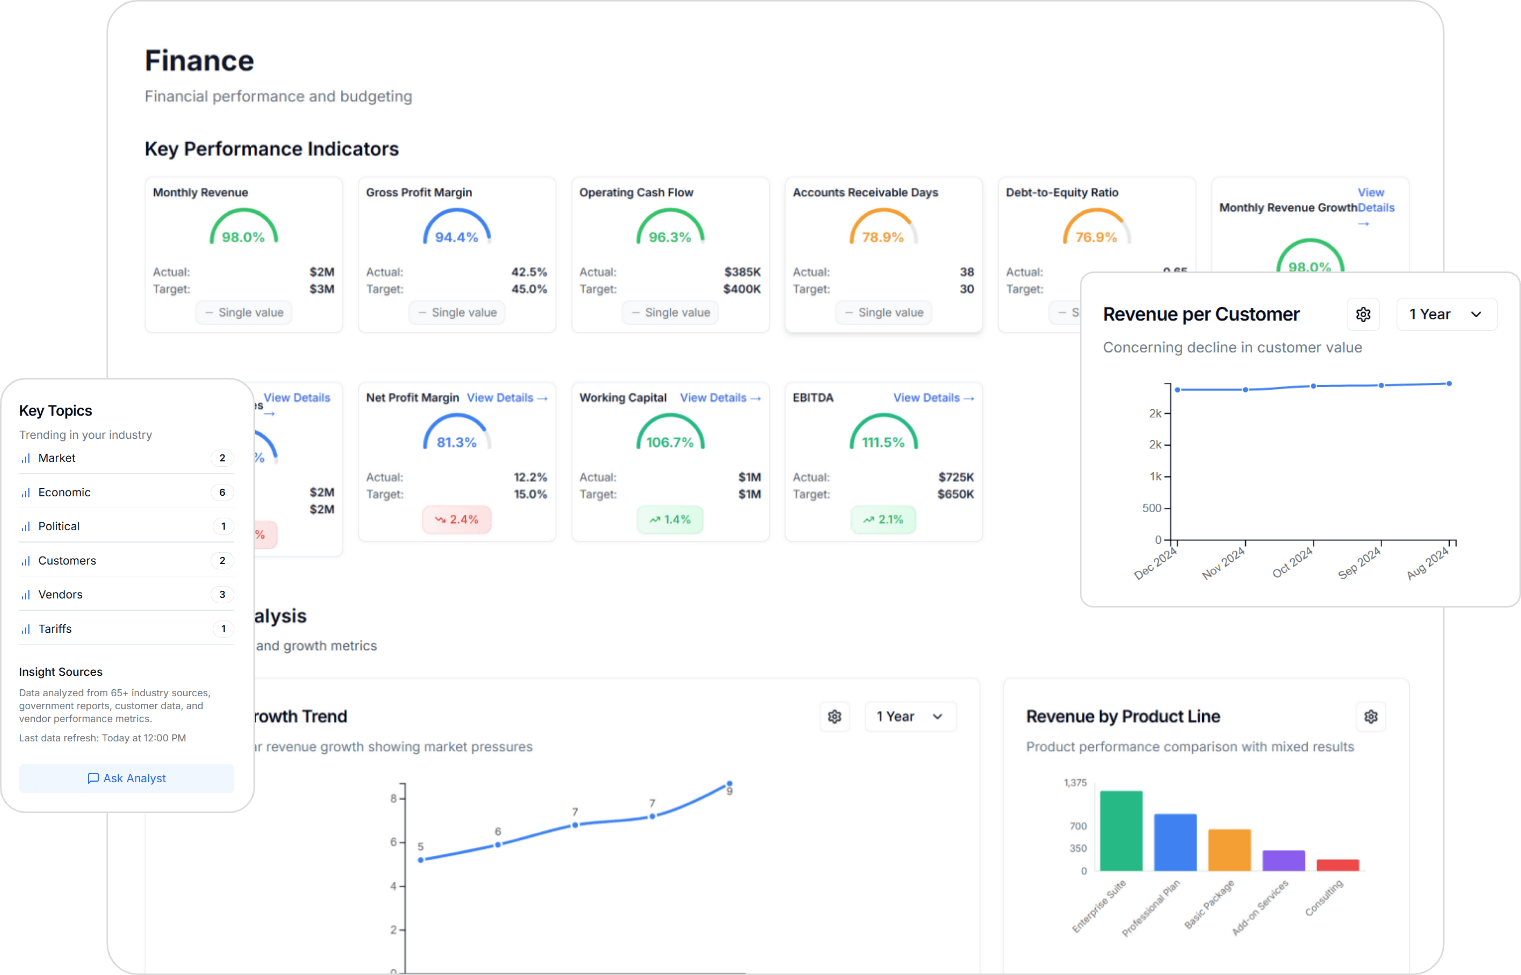
Fixed Assets Dashboard
Get all the data you need to make accurate fixed asset decisions in a single location.
Fixed Assets KPIs & Measures
- Acquisition Amount
- Acquisition System Amount
- Acquisition Reporting Amount
- Depreciation Amount
- Depreciation Reporting Amount
- Depreciation System Amount
- Disposal Amount
- Disposal Reporting Amount
- Disposal System Amount
- Net Book Value (Accounting)
- Net Book Value (Reporting)
- Net Book Value (System
Discover a faster way to generate fixed asset insights, guaranteed
We fast-track data maturity for organisations, delivering pre-built, high-impact analytics far quicker than in-house teams or third-party consultants. Our out-of-the-box modules enable us to deliver the vast majority of your analytics needs immediately, while still allowing you to tailor reports to your specific goals.
We’re so confident in our ability to deliver that we give every client the following guarantees**:
80%
of your BI analytics ready out of the box from day one
50%
faster implementation, freeing up your team’s time and budget
50%
reduction in data engineering costs
**The “80% analytics-ready” figure applies specifically to engineering tasks such as data ingestion, integration, and preparation. The 50% faster implementation and 50% reduction in engineering costs are based on our observed averages across typical client projects. Actual results may vary depending on project scope, data quality, and unique business requirements.
10+
Key Performance Indicators
3
Reports and Dashboards
5+
Pre-Defined Calculations